
The latest portfolio results (and commentary) are now available.
Please check your e-mail or, for non-members, please sign up for free HERE
Thursday 1 December 2011
Wednesday 28 September 2011
Carclo and Kindle Fire?
Does anyone know if Carclo and Amazon have gotten together re. the new Kindle Fire?
I'm amazed that they are promoting it at such a low price. Could it be based on the Carclo CIT technology? If so, it bodes well for Carclo IMO.
What do you think? Amazon and Carclo - A Marriage made in heaven?
I'm amazed that they are promoting it at such a low price. Could it be based on the Carclo CIT technology? If so, it bodes well for Carclo IMO.
What do you think? Amazon and Carclo - A Marriage made in heaven?
Monday 26 September 2011
FTSE100 - Was Fridays Doji a reversal signal?
Last Friday (23rd September 2011), the FTSE100 created a 'Doji' - a well known technical analysis signal - see video below...
This could be either:
This could be either:
- A reversal indicator
- A false signal
Wednesday 21 September 2011
Carclo (290p) - Breaking Out?
Carclo looks to be breaking out from its downtrend over the past three days (see graph below)...

From the TA point of view, bullish points are:
Let us know what you think!

From the TA point of view, bullish points are:
- Strong OBV
- Buy signals on Stochastic & MACD indicators
- RSI picking up nicely
- Closed above the 200 day moving average
- Recent RNS (12th August 2011) very positive re. CIT expected to be ready at end of September
- Microsoft getting interested (presentation: 19th September 2011)!
- Positive AGM Statement (16th September 2011)
Let us know what you think!
Monday 12 September 2011
Landkom International - still waiting for answers!
Been trying to contact the Landkom International FD (John Mapplebeck) today. He hasn't returned my call, so unable to shed light on the mystery about the RNS (7th September 2011) - re. the figures that don't add up - see diy-investors.com videocast for details.
Will provide an update when I hear...
Regards, Mick.
Will provide an update when I hear...
Regards, Mick.
Monday 15 August 2011
Havelock Europa creeping up (SP=15.88p)
Havelock Europa seems to have weathered the recent financial turmoil reasonably well. Our latest views were posted out to diy-investors members last week, see research HERE.
The shareprice graph has a nice shape to it (see below)...

The following points are worth noting:
Let us know what you think, by e-mailing us at feedback@diy-investors.com (or post a message here).
The shareprice graph has a nice shape to it (see below)...

The following points are worth noting:
- Very low PSR (0.06)
- Rising 200 day moving average (shareprice turned up just above this!)
- Strengthening on-balance-volume (OBV)
- Buy signal on the MACD indicator
- Rising relative strength - but not overbought
Let us know what you think, by e-mailing us at feedback@diy-investors.com (or post a message here).
Monday 8 August 2011
The answer is a resounding "Down"!
The Dow Jones Industrial Average closed tonight at 10,811 (down by 634 points or 5.54%) - answering the question that I had posed on 3rd August. See below...
 Checkout the full story at MarketWatch
We could be in for an interesting day on the LSE tomorrow!

We could be in for an interesting day on the LSE tomorrow!
Wednesday 3 August 2011
Which way for the Dow?
The trading session for the Dow Jones Industrial Average today will be watched very closely! At the close last night, the DJIA has dropped by 265.88 points - a drop of 2.19%. It had also closed below the 200 day moving average - raising a question in my mind about which way will it go? See below...

You will see that, in the recent past, the DJIA has shown a tendency to bounce back within a few trading sessions of having closed below the 200 day m.a. (see Summer 2010 for examples of this). Also, I've noticed that the common 2-day reversal pattern (Hi-Lo, Lo-Hi) featured in March this year (see the L.H. circle on the graph above).
Today, I believe there will be a clear and decisive outcome. Either another 2-day reversal (mirroring March) or a decisive break even lower. Which will it be?
Well, logically, you might think that with the US politicians getting their act together at the 11th hour - it will indeed turn and start a new uptrend. The bears, on the other hand, will argue that there are a lot of pointers to a continuing downtrend - not least of which is the sheer size of the budget deficit.
For my part, I'm not going to predict or even guess - but I will be watching and ready to take action (within my US trading account).
What do you think? Will the DJIA finish up or down tonight?
Tuesday 19 July 2011
Real Good Food Group (AIM: RGD, SP=68.5p) - Repeating Pattern?
Checking Sharescope this evening, I've noticed that Real Good Food Group (AIM: RGD) appears to have broken above the resistance line, marking the lower highs of recent weeks. Could it be that it will repeat the pattern of the period between 19th May and 3rd June? During that time, the shareprice rose by about 50% in a few days. Looking at the graph (see below), it might be about to repeat the same pattern.

The 8 day (fast) ADX appears to be giving a buy signal. The only slightly worrying aspect is the fact that the shareprice is well above the current 200 day moving average. Is this a true breakout or a false one? Only time will tell. Will RGD go up again in the next two or three weeks or back down towards the 200 day moving average? What do you think?

The 8 day (fast) ADX appears to be giving a buy signal. The only slightly worrying aspect is the fact that the shareprice is well above the current 200 day moving average. Is this a true breakout or a false one? Only time will tell. Will RGD go up again in the next two or three weeks or back down towards the 200 day moving average? What do you think?
Monday 18 July 2011
DIY-Investors.com - Portfolio Results for 6mths to 30th June 2011
I have published the details of the Portfolio Results for the six months to 30th June 2011 on the DIY-Investors website HERE
The outperformance, measured against the all-share index is significant. How have your portfolios performed against your benchmark indices so far this year? Anyone got any experiences to share?
The outperformance, measured against the all-share index is significant. How have your portfolios performed against your benchmark indices so far this year? Anyone got any experiences to share?
Tuesday 5 July 2011
Harvest this one while you can!
Landkom International (LKI), SP = 6.5p, has been on my radar screen for a few weeks and I was planning to prepare a research report on it when I get back from holiday. However, in view of the recent price action and the recent RNS, I thought you all might like to check it out for yourselves this week!
Sunday 3 July 2011
DIY-Investors 2011 Sharepicks - after 6 months!
As a slight distraction from a very sunny Sunday morning, I've been taking a look at the performance of the DIY-Investors.com 2011 sharepick portfolios. The results are quite interesting as you can see below...
First though, let's take a look at what the all-share index (ASX) has been doing for the first six months of the year. You may remember that it began the year on 3062.80. Well, at the close of play on 30th June, it was at 3091.90. The slight increase of 29.10 (+0.95%) means effectively no real change in the benchmark index that we use. So what then of our portfolio performance?
Looking firstly at the 10 (passive) sharepicks in the DIY-Investors.com portfolio, the value has increased by +16.90% - outperforming the index by 15.95 percentage basis points. This despite the lousy performance of MBL! You'll remember that when I took over a duplicate portfolio to actively manage it for the year, the first thing that I did was to sell MBL (to cut [stem] my losses on that pick). This seems to have been a good move as my actively managed portfolio now shows a gain of +32.73% (outperformance of 31.78%).
With the focussed portfolios (5 shares), the results are much closer. The passive (focussed) portfolio shows a gain of +66.5% (outperformance of 65.4%), while my actively managed (focussed) portfolio has just crept ahead - showing a gain of +68.46% (outperformance of 67.51%).
I'll post the tables showing individual share performances on my return from holiday. In the meantime, do please let us know how your own portfolios have performed in the first 6 months of the year.
Thursday 23 June 2011
Havelock Europa (AIM: HVE, SP=14p) - where are the results?
A keen member of DIY-Investors.com (Mike W.) e-mailed me to ask what my views were on Havelock Europa (AIM: HVE).
The background to HVE is that it moved from the main market to AIM and in recent months a private investor (Andrew Burgess) has been steadily buying a stake in the Company and now owns 13% of the £5.9m Company. Preliminary results for the year ended 31st December 2010 were expected by today (23rd June) but have still not been published. Enquiries of the Company have elicited the fairly unhelpful response that they will be posted by the end of the month. Not surprisingly, Mike and many other investors are concerned about this (take a look at any bulletin board to confirm this).
The shareprice graph for the past 4 years makes a sorry picture (see below):

My response to Mike is set out below...
Dear Mike,
You will not be surprised to learn that HVE has been on my watchlist for
some time, particularly as it so typifies Companies that are depressed and
unloved. As mentioned in the book, they offer opportunities for
significant upside as they recover.
Looking specifically at HVE, my immediate comments are:
1. It has a very low PSR (good). If you look at the past operating margin,
it has consistently been between 5% and 6.9% over the 7 years (2002 to
2008). On recovery, it should be able to get back to 5%. As HVE hasn't
diluted its shareholding (yet) and has finance in place - therefore
unlikely to have a rights issue or placing (hopefully), then trading its
way out of trouble gives rebound possibilities. It's not beyond reasonable
expectation for HVE to get back to eps of 8 to 10p in two to three years
time - giving a very low PE ratio.
2. You are right to note the private shareholder (Andrew Burgess). There
are several well known people of this name, so it's not possible to find
out who this one is - well at least for you and I! Have a look at what
happens when you 'Google' the name (2 or three possible candidates in the
field of investment/business pop up). You'll recall from "Picking Winning Shares" (PWS) that in the
case of GTL Resources, I had picked up the potential significance of a
large shareholding by a private shareholder (see PWS, p.24).
3. In terms of shareprice movements, it has all the classic stair step
recovery shape - particularly since it broke up through the 200 day moving
average. If the results are not as bad as people seem to expect, then 2011
could be a reasonable year for you as an investor in HVE.
4. In terms of the markets that HVE operates in, I do have some knowledge
of these as I run a Company of architects (for my day job). ESA school
furniture (labs & technology workshops etc) should recover as school
spending picks up - the Government have started to put some funding into
the new Academies. Also, retail and banking spend on fit outs is gradually
increasing (see also Styles and Wood [STY], whose shares are also showing
similar early stage recovery signs).
5. The printing side of HVE, coupled with the investment and growth
reported at the interim stage could also be a good story.
Having taken a little longer to review the fundamental and technical analysis, the following additional points may be relevant:
a) Net debt has been rising £19.9m at 31/12/2009 although at that date, less than £3m of that seems to be short term debt. At the interims, released 23rd September 2010, this had risen to £22.3m. The Company stated at that time that "The group continues to operate within its new bank facilities".
b) The shareprice graph for the past twelve months makes interesting viewing...

Note the following points:

This shows that the year ended 31/12/2009 was a very poor one for HVE. That said, if the prospects are improving (as suggested in the interim results), then with only 38.53m shares issued a rebound in the eps and possible re-rating is a strong possibility.
c) If the turnaround happens and dividend payments are resumed, then the current purchase price of a share could easily be repayed by dividend payments over the next 5 to 7 years.
d) Could a bid be forthcoming (or even be under discussion by the Board now)? The Company seems to be trading at about its tangible book value.
e) Speculation: Is the digital printing operation (now at Letchworth) benefitting from the run up to the Olympics and/or slightly improved economic conditions?
In conclusion...
A risky turnaround prospect, because of the debt - but aren't they all?
Usual caveats - do your own research etc...
Mick.
The background to HVE is that it moved from the main market to AIM and in recent months a private investor (Andrew Burgess) has been steadily buying a stake in the Company and now owns 13% of the £5.9m Company. Preliminary results for the year ended 31st December 2010 were expected by today (23rd June) but have still not been published. Enquiries of the Company have elicited the fairly unhelpful response that they will be posted by the end of the month. Not surprisingly, Mike and many other investors are concerned about this (take a look at any bulletin board to confirm this).
The shareprice graph for the past 4 years makes a sorry picture (see below):

My response to Mike is set out below...
Dear Mike,
You will not be surprised to learn that HVE has been on my watchlist for
some time, particularly as it so typifies Companies that are depressed and
unloved. As mentioned in the book, they offer opportunities for
significant upside as they recover.
Looking specifically at HVE, my immediate comments are:
1. It has a very low PSR (good). If you look at the past operating margin,
it has consistently been between 5% and 6.9% over the 7 years (2002 to
2008). On recovery, it should be able to get back to 5%. As HVE hasn't
diluted its shareholding (yet) and has finance in place - therefore
unlikely to have a rights issue or placing (hopefully), then trading its
way out of trouble gives rebound possibilities. It's not beyond reasonable
expectation for HVE to get back to eps of 8 to 10p in two to three years
time - giving a very low PE ratio.
2. You are right to note the private shareholder (Andrew Burgess). There
are several well known people of this name, so it's not possible to find
out who this one is - well at least for you and I! Have a look at what
happens when you 'Google' the name (2 or three possible candidates in the
field of investment/business pop up). You'll recall from "Picking Winning Shares" (PWS) that in the
case of GTL Resources, I had picked up the potential significance of a
large shareholding by a private shareholder (see PWS, p.24).
3. In terms of shareprice movements, it has all the classic stair step
recovery shape - particularly since it broke up through the 200 day moving
average. If the results are not as bad as people seem to expect, then 2011
could be a reasonable year for you as an investor in HVE.
4. In terms of the markets that HVE operates in, I do have some knowledge
of these as I run a Company of architects (for my day job). ESA school
furniture (labs & technology workshops etc) should recover as school
spending picks up - the Government have started to put some funding into
the new Academies. Also, retail and banking spend on fit outs is gradually
increasing (see also Styles and Wood [STY], whose shares are also showing
similar early stage recovery signs).
5. The printing side of HVE, coupled with the investment and growth
reported at the interim stage could also be a good story.
Having taken a little longer to review the fundamental and technical analysis, the following additional points may be relevant:
a) Net debt has been rising £19.9m at 31/12/2009 although at that date, less than £3m of that seems to be short term debt. At the interims, released 23rd September 2010, this had risen to £22.3m. The Company stated at that time that "The group continues to operate within its new bank facilities".
b) The shareprice graph for the past twelve months makes interesting viewing...

Note the following points:
- Rising OBV (good)
- 200 day moving average has now turned up (good)
- SP (at 14p) is not too far above the 200 day moving average
- Any further slight drop should be supported by the support line (which was previously resistance) at about 11.3p

This shows that the year ended 31/12/2009 was a very poor one for HVE. That said, if the prospects are improving (as suggested in the interim results), then with only 38.53m shares issued a rebound in the eps and possible re-rating is a strong possibility.
c) If the turnaround happens and dividend payments are resumed, then the current purchase price of a share could easily be repayed by dividend payments over the next 5 to 7 years.
d) Could a bid be forthcoming (or even be under discussion by the Board now)? The Company seems to be trading at about its tangible book value.
e) Speculation: Is the digital printing operation (now at Letchworth) benefitting from the run up to the Olympics and/or slightly improved economic conditions?
In conclusion...
A risky turnaround prospect, because of the debt - but aren't they all?
Usual caveats - do your own research etc...
Mick.
Thursday 16 June 2011
GTL Annual results 2011 - Still generating Cash!
Although I've not seen an RNS about the Annual Results for GTL, I did find the results on the Company Website HERE. I'm in the process of reading through them but my initial reaction is that, despite the marginally lower profit, cash generation (and debt reduction) provides very positive news.
What do you think?
What do you think?
Monday 13 June 2011
CML Microsystems (LSE: CML) at 212p - set for an interesting day tomorrow?
With the preliminary results due out tomorrow, we've been taking a look at CML Microsystems and have come up with some interesting conclusions ... take a look here
Monday 6 June 2011
Could Carclo be the Technology share to own for the future?
Carclo (FTSE Small Cap: CAR) closed at £3.00 last Friday but could be one to watch for the future. The most exciting part of this Company is (read full article here)...
Tuesday 31 May 2011
DIY-Investors Sharepicks for 2011 - Performance to 31st May 2011
Subscribers to DIY-Investors.com will recall that, on 31st December 2010, we picked two portfolios, each of £10,000 for 2011. One had 10 sharepicks (£1,000 invested in each share) and the second was more concentrated - having 5 sharepicks (£2,000 invested in each share).
Performance to 31st May 2011 (5 months), as follows:
10 SHAREPICKS - Overall Gain: +15.52% (portfolio value: £11,550.61)
5 SHAREPICKS - Overall Gain: +61.23% (portfolio value: £16,124.43)
The same two portfolios, actively managed by Mick (using the techniques contained in his book "Picking Winning Shares") since March 2011, returned the following results to date:
10 SHAREPICKS - Overall Gain: +28.41% (portfolio value: £12,839.12)
5 SHAREPICKS - Overall Gain: +56.41% (portfolio value: £15,642.19)
As a comparison, the all-share index closed at 3118.86 this afternoon, a gain of 56.06 points (1.83%) above the level at the start of the year (3062.80).
As you can see, all portfolios have significantly outperformed the all share index!
Saturday 28 May 2011
Wednesday 25 May 2011
Pace PLC (LSE: PIC) - £1.095 leaves change for the seasickness pills!
Tonight I've taken a look at PACE - see the videocast below!
As I mentioned in the video, you can see the need for seasickness pills with this one!
Do you think it will close the gap?
As I mentioned in the video, you can see the need for seasickness pills with this one!
Do you think it will close the gap?
Sunday 22 May 2011
Real Good Food (54.5p) - Breakout?
Real Good Food Group (AIM: RGD), one of our sharepicks for 2011, looks as if it is on the move again!

Following a lateral breakout from the minor downtrend of the last month or so, a buy signal seems to be indicated by the price action (see graph) and also confirmed by the Stochastic and ADX indicators.
The AGM is due on 2nd June - do you think there is more good news to come then?

Following a lateral breakout from the minor downtrend of the last month or so, a buy signal seems to be indicated by the price action (see graph) and also confirmed by the Stochastic and ADX indicators.
The AGM is due on 2nd June - do you think there is more good news to come then?
Friday 20 May 2011
Will Iofina be a summer sizzler?
You could be forgiven if you haven't heard of Iofina (AIM: IOF), as it has been keeping it's head down - building its business of iodine and natural gas production. It closed today at 31.75p, giving a MCAP of £35.6m.
Please invest 5 minutes to look at this video and let me know what you think of the prospects for Iofina.
If you missed the link, within my videocast, to the presentation (produced by Noble Investments) - made by Iofina's CEO (Lance Baller), you can use this link. You will need 30minutes to watch the complete presentation but it is very worthwhile if you are considering investing in this Company.
Usual warnings ... DYOR etc.
Tuesday 10 May 2011
Coastal Energy (£4.135) - A Thai Beauty?
Coastal Energy Company (AIM: CEO, TSX: CEN), closed up 38.5p (+10.3%) at £4.135 today, valuing the Company at £452.8m. This followed the announcement of successful drilling results at the Company's 100% owned Bua Ban North B field (offshore Thailand).
The 2 year shareprice action is shown below:

As you can see, since the reversal (6th - 8th February 2011), CEO has been in an intermediate downtrend. However, the news today and the resulting rise in shareprice indicates a break in that downtrend (see below):

Looking at the technical analysis, you will see that the OBV kinked up and that the stochastic indicator also broke up through the resistance line (marking the lower highs). The ADX +DI line also broke through the -DI line (although the fast [8day] ADX is at 24, whereas I normally like to see it above 25). The probability is that this marks the start of a new uptrend.
It looks as though the TA is in tune with the fundamentals on this stock, making it a buy! What do you think?
Do please let us know your views. Mick.
Wednesday 27 April 2011
Styles & Wood Group - Breakout?
Styles & Wood group (FTSE Fledgling: STY) closed at 13.25p yesterday but looks set to break out from its downtrend which started at the beginning of January.
STY provides property services to major retailers, banks and commercial organisations and has had a tough time in recent years as the long term price graph shows (see below).

As you can see, a drop from £43.05 (11th April 2007) to 11.00p (9th December 2010), a fall of £42.94 (-99.7%) is fairly desperate!
However, lets go in a bit closer and take another look at the recent price action...
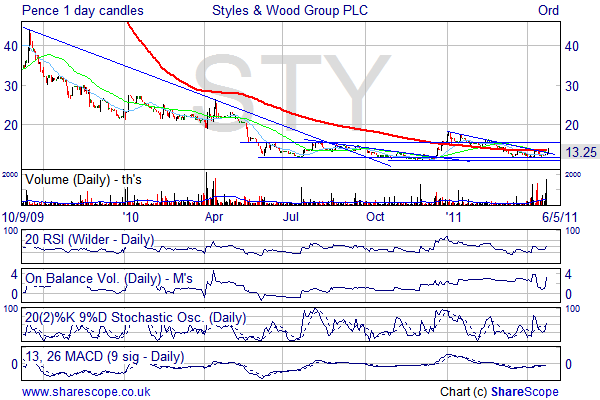
The graph above, covering the last 18 months or so, shows how STY is beginning to show signs of life. The first signs of a break came in December 2010, when the share price shot up from 11.25p to 17.75p (a rise of 61.4% in 26 days). This rise wasn't sustained however and STY has been steadily declining so far this year.
In terms of fundamentals, STY is reasonably well placed. Some of the key facts from the preliminary results for the year ended 31st December 2010 (announced on 13th April) are:
Looking at the price action since 13th April is worthwhile (see the daily chart below).

The price action yesterday seems to me to be a clear buy signal. The 14 day ADX indicator gave a buy signal (foretold by the 8 day ADX a couple of days ago). OBV has picked up nicely since the results were announced and the 200 day moving average is nicely flat. Volume has also been picking up nicely, suggesting we are in a period of accumulation.
Interestingly, as I'm completing this blog post, I've just checked the shareprice of STY to see that it's jumped this morning (currently: 14.5p at 12:55, Wednesday 27th April). One to give serious consideration to?
I'd be interested to hear your views on the prospects for STY.
Usual warnings - Do your own research etc...
STY provides property services to major retailers, banks and commercial organisations and has had a tough time in recent years as the long term price graph shows (see below).

As you can see, a drop from £43.05 (11th April 2007) to 11.00p (9th December 2010), a fall of £42.94 (-99.7%) is fairly desperate!
However, lets go in a bit closer and take another look at the recent price action...

The graph above, covering the last 18 months or so, shows how STY is beginning to show signs of life. The first signs of a break came in December 2010, when the share price shot up from 11.25p to 17.75p (a rise of 61.4% in 26 days). This rise wasn't sustained however and STY has been steadily declining so far this year.
In terms of fundamentals, STY is reasonably well placed. Some of the key facts from the preliminary results for the year ended 31st December 2010 (announced on 13th April) are:
- Revenue £99.1m (2009: £139.3m)
- Underlying operating profit £1.4m (2009: 1.8m)
- Net Loss £0.9m (2009: Net Loss £1.7m) - reduction of 47%
- Gross Margin 7.8% (2009: 6.4%)
- Net cash £7.5m (31/12/2009: £8.4m)
- MCAP - £7.88m
Looking at the price action since 13th April is worthwhile (see the daily chart below).

The price action yesterday seems to me to be a clear buy signal. The 14 day ADX indicator gave a buy signal (foretold by the 8 day ADX a couple of days ago). OBV has picked up nicely since the results were announced and the 200 day moving average is nicely flat. Volume has also been picking up nicely, suggesting we are in a period of accumulation.
Interestingly, as I'm completing this blog post, I've just checked the shareprice of STY to see that it's jumped this morning (currently: 14.5p at 12:55, Wednesday 27th April). One to give serious consideration to?
I'd be interested to hear your views on the prospects for STY.
Usual warnings - Do your own research etc...
Monday 18 April 2011
Titan Europe (88p) puts the wheels back on!
Titan Europe Announced preliminary results, for the year ended 31st December 2010, today. TSW manufactures wheels and undercarriages for the global construction, agriculture and mining sectors and has operations in several countries.
The highlights of the results are:

The graph shows the nice move up today (+11.39%) on strengthening volume. The OBV has kicked up nicely in the past two days and the RSI and MACD are nowhere near overbought teritory. A quick look back at the longer term chart reveals an interesting angle...
 The "eagle eyed" DIY-Investors amongst you will have noted the huge gap (arrowed on the graph) to the downside that occured in September 2008, when TSW dropped from 122p to 64p in a day. This fall of 58p (47.5%) from the previous close, on volume of just over a million shares traded, was followed by more heavy selling over the next few days. This sets up TSW for the possibility of a significant move up over the next few days, as people digest the figures and start to buy back in. In my opinion, I believe that the 122p target may well be reached within the next few weeks. A positive change in sentiment is supported by the news, released with the results, that Q1 2011 turnover is 66% up on the first quarter last year. This sets us up nicely for another jump in turnover within the next twelve months.
Do you agree with my interpretation of the prospects for TSW? Do let us know what you think by leaving you comments below.
The highlights of the results are:
- Turnover up £96.6m (+37.35%) from £258.6m to £355.2m
- Operating profit improved by £45.8m to +£12.3m (FY 2009, loss: £33.5m)
- Pretax profit £3.4m up by £44.8m from 2009 loss of £41.4m
- Net debt reduced by £15.2m, to £132.8m (31.12.2009: £148m)
- Diluted eps of 3.14p (2009: loss per share of 41.44p)

The graph shows the nice move up today (+11.39%) on strengthening volume. The OBV has kicked up nicely in the past two days and the RSI and MACD are nowhere near overbought teritory. A quick look back at the longer term chart reveals an interesting angle...

Do you agree with my interpretation of the prospects for TSW? Do let us know what you think by leaving you comments below.
Sunday 27 March 2011
DIY-Investors Sharepicks for 2011
Subscribers to the diy-investors.com website will be aware that we picked two virtual portfolios for 2011. The first took a notional £10,000 and invested this equally into ten shares. The second was more focussed, spreading the fund equally between five shares. Although this is OK as a comparison with the annual ritual that the mainstream newspapers engage in, it doesn't reflect the reality of my approach as an active DIY-Investor.
I have therefore taken up the challenge of actively managing two (mirror) virtual portfolios, using the same sharepicks as my starting point. However, I am applying the portfolio management techniques (as set out in chapter 14 of my book "Picking Winning Shares", coupled with the selling techniques as set out in chapter 15).
So far, the only change that I have made was to have sold MBL group (incurring a loss to the portfolio of £418), following the deterioration of the price action after the profit warning on 31st January 2011. The proceeds were invested in Pendragon (2431 shares purchased at 23.25p). This has, so far, proved to be the correct move as MBL Group has now dropped to 12p (having had the contract for the supply to Morrisons terminated, as announced on 15th March 2011).
I'm currently monitoring the virtual shareholdings in the two actively managed portfolios and at diy-investors.com, we'll be comparing the passive and actively managed virtual funds quarterly as we go through the year. We'll circulate the first quarter results to our subscribers over the weekend of 2nd/3rd April.
I believe that I can outperform the passive virtual funds - but by how much over the full 12 months? Anyone like to offer an opinion as to how many percentage basis points this might be?
Friday 25 March 2011
Is HaiKe Chemical Group (SP=32p) about to take off?
Is Haike Chemical Group (AIM: HAIK), about to start another short term uptrend?
Over the past 4 years, HAIK has been in a downtrend, characterised by very volatile short term moves (see graph below).

Is there any reason to expect the shareprice to turnaround? Well I believe the answer may well be yes. The recent positive news about both turnover and profitability, coupled with the commencement of production at the jointly owned Ruilin Refinery, could well be the reason. The increase in gasoline and diesel prices,by the PRC Government in December, may also have a positive effect going foreward.
Analysing the recent news, it appears that the full year Turnover, for the year ended 31/12/2010, will be around £780m. On the current shareprice of 32p and with 38.4m shares issued, the MCAP is currently around £12.3million. This gives a PSR of only 0.016. This appears to be extremely low for a Company with such a large turnover and located in such a growing market. Note also that, for the years ending 2005 to 2007, HAIK managed an operating profit of between 5 and 7%. Any slight improvement in profitability, coupled with the rapidly increasing turnover, will be likely to lead to a massive increase in profit and hence eps (based on the current 38.4m shares issued). A re-rating is therefore quite likely!
What about the recent chart action? Well, here too there are grounds for some optimism (see below):

As you can see, since the last RNS (20th January 2011), the shareprice has dropped from 73p to 32p (a fall of 56%). However, note that the 200 day moving average is sloping up and providing support to the price. Also, there appears to be buy signals on both MACD and stochastic secondary indicators. RSI is also oversold but the OBV is very strong. The recent decline has also taken the price back to about the level where it broke (laterally) out of the 4 year downtrend, at the end of November 2010. In my opinion, this could be the last buying opportunity at this level, as the full year results (expected at the end of June 2011) are likely to show huge growth in turnover, and a "modest profit" (as per the RNS of 20th January).
What do you think?
Usual warnings DYOR etc.
Monday 14 March 2011
"Picking Winning Shares"
Well, at last my book is published - you can now buy it on Amazon HERE!

The back cover image is here ...

I hope you enjoy reading it and that it helps with your investing.
Kind Regards, Mick.

The back cover image is here ...

I hope you enjoy reading it and that it helps with your investing.
Kind Regards, Mick.
Wednesday 9 March 2011
A real good price move!
Real Good Food Group closed at 37.5p today (up 8.3%), breaking through the overhead resistance (see chart below).

The preliminary results are due on 29th March and based on the last RNS, we can expect a pleasant surprise. If the forecast turnover of £220m is met and given todays MCAP of £24.4m, RGD is still on a paltry PSR of 0.11. Expect a re-rating if the results are good.
Looking at the longer term chart, the next serious price resistance is expected at the 80 to 81p price level.
Will this one double again in the next year? What do you think?
You may also have noticed that RGD is available as a free case study HERE.
As ever, do the DIY-Investors thing and "make up your own mind!"
Wednesday 16 February 2011
Is Uniq unique?
Uniq (SP=13.25p) underwent an explosive breakout today, closing up 5.75p (+74.92%). Of the 115million total shares available, 9.96m changed hands (8.7%), making this a significant move.

Was any of this foreseeable? Well we thought so, hence UNIQ was one of our picks for 2011. Another one of our picks for the year went up 21.18% today on a very impressive set of annual results. Want to get details? Join our community of DIY-Investors Here.

Was any of this foreseeable? Well we thought so, hence UNIQ was one of our picks for 2011. Another one of our picks for the year went up 21.18% today on a very impressive set of annual results. Want to get details? Join our community of DIY-Investors Here.
Monday 7 February 2011
Pendragon (20.5p) - Start of a new upward move?
Fully listed Pendragon (PDG), closed today at 20.5p, up 2.5p or 13.89%. With the preliminary full year results due on 28th February 2011, is this the start of a new upward move?
On a fundamental basis, PDG is currently on an exceptionally low PSR of 0.04 (compared to the sector average of 0.87). Similarly, its PER is currently only 5.31 (sector average is 13.7). Analysts are expecting the eps for y/e 31.12.2010 to have grown 203% to 2.53p, with another 34% growth in earnings expected for 2011 (to 3.39p).
What of the technicals? Well have a look at the grapth for the past 9 months (below):

From this, you can see that the closing price (20.5p) has nudged through the resistance line, extended from the two previous highs (Aug 2009 & April 2010). Similarly, it has broken through the shorter term resistance line (September 2010 to present).
Of particular note is the strengthening OBV, giving a positive divergence with the falling shareprice. Also, we have buy signal on the Stochastic Indicator. Similarly, the RSI and OBV have kicked up nicely today.
All of this bodes well for the future, as it mirrors the breakout that took place early in January 2009 (see graph below).

What you think about the prospects for Pendragon?
Friday 4 February 2011
DCD Media (SP=9.625p) - Buying Opportunity?
DCD Media (AIM: DCD) ticked up 0.75p (6.9%) today. The share price graph (below) shows a clear reversal signal ...

Note also that the on-balance-volume (OBV) is very strong. Couple this with oversold indictions from RSI and MACD and we seem to have a good opportunity to buy into a small company with improving prospects.
The longer term graph (below) shows the price history.

The decline from 2007 to 2010 indicates a classic depressed stock. However, after a period of "bottoming out", there now seems to be some indications of a resurrection in the share price. Our interest started when Taya Communications increased their holding to 12.145 million shares (19.87%) - clearly they had spotted some value here! DCD Media has nine operating companies producing and selling television programmes and licensing various rights to third parties. The accounts for the year ended 30th June 2010 showed an improving balance sheet, with £4.9m in cash - not bad for a company with a current capitalisation of £5.9million!
With a low PSR (0.17) and improving prospects, we believe that this is well worth adding to our DIY-Investors portfolio.
What do you think?
Monday 31 January 2011
API - Breakout (after double bottom)
API Group closed at 19.5p today (up 3.5p or 21.88%). This comes following the recent news about the disposal of API's joint venture interests in China. Since the release of the much improved interim results, on 2nd December 2010, API has been hovering around the 15 - 16p level. The chart (below), shows the recent action...

The volume yesterday (6.73m shares) was quite decisive and was followed by todays rise, on lower volume (527 thousand shares). As you can see, with good technical indicators and now with the fundamentals seeming to be on an improving trend, this is one well worth watching for us DIY-Investors!

The volume yesterday (6.73m shares) was quite decisive and was followed by todays rise, on lower volume (527 thousand shares). As you can see, with good technical indicators and now with the fundamentals seeming to be on an improving trend, this is one well worth watching for us DIY-Investors!
Thursday 13 January 2011
Luminar Group Holdings (LMR) - Breakout?
Luminar closed at 15.75p today, breaking through the short-term resistance line and showing the first signs of life since its last minor high on 20th October 2010. The sharescope graph (below) shows very clearly the gradual splutterings of life beginning to appear.
 The on balance volume (OBV) has remained strong since October and, until today's announcement about recent trading, there really hadn't been any significant response to LMR having refinced its debt in December.
However, Luminar made it into the DIY-Investors.com picks for the year and so we are not too surprised to see signs of life. For the list of ten sharepicks for 2011 and details of last years market beating performance, check out the newsletter on the DIY-Investors.com website HERE.

However, Luminar made it into the DIY-Investors.com picks for the year and so we are not too surprised to see signs of life. For the list of ten sharepicks for 2011 and details of last years market beating performance, check out the newsletter on the DIY-Investors.com website HERE.
Subscribe to:
Posts (Atom)


