Showing posts with label Breakout. Show all posts

Thursday, 28 April 2016

Avocet Mining (AVM) - Breakout?

Breakout (28th April 2016) - AVM, Q1 Production Report


The RNS released this morning, by Avocet Mining, certainly produced a positive price reaction (see the Sharepad graph below):


The RNS (Q1 Production Report) is below:


This follows hard on the heels of the preliminary results, released just two days ago...


AVM - Preliminary Results (Summary):


Mick's View:

The combination of improved gold prices, the prelim and Q1 reports (above), should be of interest to all DIY-Investors in my opinion... of course, you'll need to DYOR and make up your own minds on that!

As usual, I'd be interested in your views, so why not leave a comment below?

Mick (28th April 2016)


Tuesday, 12 May 2015

Speedy Hire (SDY) : 12th May 2015

Will Speedy Hire "Speed Up"?


Speedy Hire (SDY), issued its Preliminary Results today (12th May 2015). These show that things are progressing well at the plant hire firm (see below)...


Couple these results with the "Breakout" from the recent downtrend and DIY-Investors might well benefit from taking a closer look at Speedy Hire.


What do think of the prospects for Speedy Hire over the next 12 months?

Mick (12th May 2015)

Thursday, 4 September 2014

Redde : Preliminary Results (4th September 2014)

Excellent Set of Results from Redde (REDD)


Following a break out from the recent price downtrend (see graph below), Redde today released an excellent set of preliminary results.

Redde (REDD) - Breakout

The preliminary results included good news for those of us holding Redde shares, as a final dividend of 3.5p was announced (subject to shareholders approval). The section from the results, showing 2014 dividends is set out below...

Redde - Dividends 2014

Based on the current share price (as I write this), this equates to a 5.34% final dividend (making a 10.45% total dividend for 2014). Fair reward for shareholders I would say.

There will be more on Redde in the DIY-Investors Inner Circle Webinar this evening at 8pm. 

Thursday, 23 January 2014

Nice Breakout (23rd January 2014)

ABG Breakout Today

African Barrick Gold (ABG) rose 23p (11.5%) today and in doing so, broke through the resistance line at 212p (see the Sharescope Graph below)...

Key Metrics

The Key Metrics also show the low price-to-Tangible Book Value (PTBV) and modest PSR (1.36), see below:

Newsflow:

The recent newsflow has been positive, in particular the news released on 21st January, the key highlights being replicated below:

Highlights
  • Fourth quarter gold production of 165,374 ounces and sales of 168,177 ounces
  • Preliminary fourth quarter all-in sustaining cost of US$1,171 per ounce sold, down 30% on Q4 2012 and 8% on Q3 2013
  • Preliminary fourth quarter cash costs of US$774 per ounce sold, 19% lower than Q4 2012
  • Full year 2013 production of 641,931 ounces with full year sales of 649,742 ounces, 7% above the upper end of 2013 production guidance of 540,000 - 600,000 ounces
  • Cash balance of approximately US$282 million as at 31 December 2013
  • The average realised price of US$1,251 per ounce over the quarter and US$1,379 per ounce for the full year were 26% and 17% respectively lower than the prior year
 If you wish to access the full African Barrick Gold (4th Quarter) Production Report (pdf), you will find it HERE.

You may remember that we previously posted (Gold in this Balance Sheet?) about ABG on 13th August 2013, when the price was £1.495. You'll find that post, on the DIY-Investors website Here, if you want to refresh your memory.

I believe that African Barrick Gold could be a real nugget (groan!!!) for DIY-Investors in 2014. What do you think?

Mick (23rd January 2014)

Tuesday, 10 September 2013

Home Retail Breaks Through Resistance

Home Retail (HOME), SP = 162.5p (10th September 2013)

Home Retail has finally managed to break through the resistance line (at 160.7p), see below:


Annotated on the Sharescope graph are my notes, picking up:
  • The breakout today
  • Volume over the past three or four days
  • Rising OBV
  • Buy signals on the ADX indicators

Key Metrics


The key metrics (above) show that the cash levels have been improving over the past three years and that the PSR is still low (0.24).

Also noticeable is that the cash flow per share is much higher than the eps (noted in blue above), so putting it all together, it could be that there's scope for a possible re-rating over the next few months.

In my opinion it could be worth watching this one over the next few weeks. What do you think?

Mick (10th September 2013)


Wednesday, 21 August 2013

That's The Spirit!

Blavod - Starting To Distill Nicely (21st August 2013)?


Blavod (BES), the vodka, spirits and wine merchant, closed tonight at 0.95p, giving an MCAP of £2.9m and showing a clear breakout from two downtrend lines. The longevity of these downtrends can be seen clearly on the (annotated) Sharescope Graph below...

Blavod Long Term Graph


Looking at the graph for the past 18 months, focusses our attention in to the past few trading days (see the red arrows marked on the graph below)...

Blavod (18 month) SP Graph


Key Metrics


Blavod Key Metrics (21st August 2013)

The Key Metrics (above), show that the PSR is only 0.63 and that the debt level has been falling slowly over the past 3 years. This is a result of improving cash flow per share over the same period.

Summary

In summary, the key points to my mind are:

  • Clear move upwards approaching the results
  • OBV increasing
  • Buy Signals on the ADX
  • Low PSR (0.63)
  • Good Newsflow in 2013 (check this out on the Blavod Website HERE)

Will Blavod mature into a good investment? What do you think?

Monday, 1 October 2012

TCG starting to cook?

Thomas Cook Group, TCG (SP=18.25p, MCAP=£159.7m)

Thomas Cook Group (TCG) closed at 18.25p this evening, having broken up through the flattish 200 day moving average. This follows an interesting Pre-Close Statement last Friday (28th September), which suggested that business had improved - with late foreign holiday bookings being a strong factor.

You may remember our previous Blog Post on 19th July 2012, when we asked if Thomas Cook was turning? Well, here at DIY-Investors, we now feel that the balance of evidence is showing that this  might well be the case. So, if this is the start of a long road back to recovery for TCG, let's take another look at the evidence...

Technical Analysis

The Long Term graph doesn't make a pretty picture, as you can see:


Having fallen, from 297.5p (6th May 2009) to 10.2p on 22nd November 2011 (a drop of 287.3p, 96.57%) in two and a half years, TCG has been bumping along the bottom for some weeks.

Fundamental Analysis

Trading the breakout of such a battered stock carries risk and potential reward. The Key Metrics (below), illustrate some of the problems facing TCG...


Having turned in a thumping loss last year (£398.2m), the loss is forecast to narrow considerably in the year that has just ended (on 30/09/2012).

Positive Points include:
  • High Turnover but low PSR (0.16)
  • Well established brand name (at least in most peoples eyes!)
  • Cash-flow per share still positive last year, compared to eps (22.87p - v - 0.84p)
  • Long-Term Funding in place - see Interim Results (May 2012)
  • Positive action being taken to reduce borrowing (such as selling TCG India).
Negative Points include:
  • High (and increasing borrowings)
  • Net gearing has been rising for past 5 years
  •  The squeeze on household expenditures may adversely affect discretionary spending (such as holidays)

 Recent Price Action (and Analysis)

The recent share price action, since the panic dump of November 2011, is worth looking at in greater detail...


You can see above that the price has clearly responded favourably to the pre-close statement last Friday. Note in particular:

  • Increased volume in past two trading days
  • Higher average volume last 10 or so trading days
  • Buy signal on the ADX indicators (although I would like to see the 14 day ADX value higher)
  • RS (against the FTSE 350 Travel & Leisure) has turned up, from a low position
  • OBV has turned up
  • Improving news recently (disposals etc)
  • Horizontal Trading range of past 10 weeks has been broken to the upside
As usual, we all have to make up our own minds as DIY-Investors but the signs look promising!

Let us know what you think!

Thursday, 19 July 2012

Is Thomas Cook Turning?

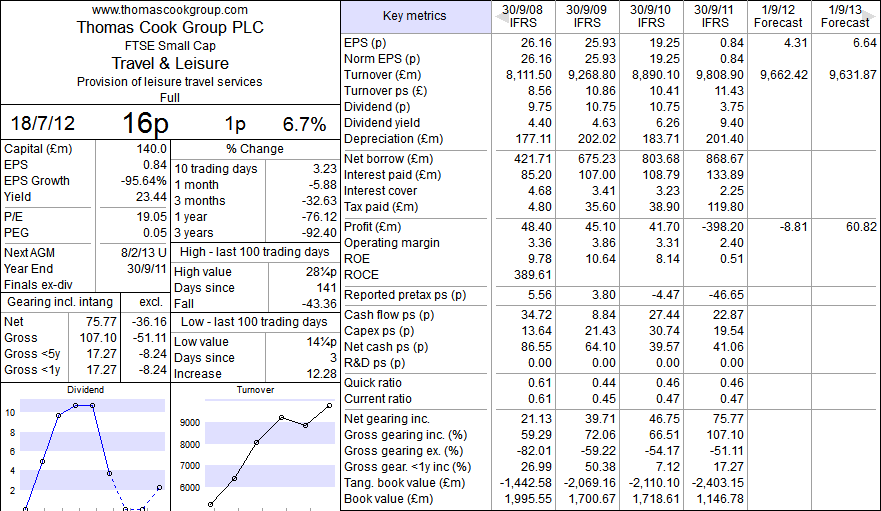
Thomas Cook Group (LSE: TCG), closed last night at 16.0p - giving a MCAP of £140m for a Company turning over in excess of £9Billion a year. What caught my attention was the clear breakout from the downtrend (see below)...


In terms of fundamentals, the Sharescope Key Metrics (below), show clearly what has been happening...


From this, you can see that the PSR(h) is only 0.014 (MCAP 140.0m / T.O. £9808m) and the PSR(pr) is 0.015 (MCAP £140.0m / T.O.(pr) £9662m), reflecting it's recent past history.

Surviving the challenges of the recession is the game for Thomas Cook and making money from successful turnarounds is one the great ways for DIY-Investors to beat the markets. So what are the factors that we should take into account in making our decision about whether to invest or not?

Well, from my research this morning, here is the position as I see it:


Technical Analysis

Having suffered a drop from 272p (Spring 2010) to the recent low of 10.2p (22nd November 2011), with a fall of 96.3% in the past 28 months or so (see below), the shares in TCG can truly be said to be "out of favour" with the smart city money.


However, there is a clear breakout from the downtrend, coupled with the following signals which you could argue are the first indications of a change of sentiment (and possible opportunity for us DIY-Investors). The short term graph (below) is very interesting!


From the initial breakout (above the 50 day m.av.), the price drifted back, went sideways but then met resistance from the downtrend line until Tuesday 17th July, when it broke through. It did this very "quietly" with no great volume to announce this to the World. Yesterday, it followed with another tick up, with slightly increased volume (but still nothing to shout about).

However, what sealed it for me was the very slight twitch (up) on the OBV, coupled with the buy signal on the ADX indicators (lower two secondary indicators above). The RSI also started to turn up.

The Debt Problem

TCG have made it clear that lowering debt has been made a priority and the Shareholders Approval (29th May 2012) to "Life Saving Asset Sales", coupled with the appointment of Harriet Green (previously boss at Premier Farnell) as the new CEO to mastermind the recovery (or should it be resuscitation?).

The proposed sale of its Spanish Hotel Chain and a 77% stake in Thomas Cook India, together with proposed sale & leaseback of some aircraft might just be enough to allow the patient to breath.


Summary

There is clearly a lot of risk in investing in TCG but having just re-read Peter Lynch's book "One Up on Wall Street"  during my recent (wet) holiday in Cornwall, I can see potential reward too!

As ever, please "Do Your Own Research" and make up your own mind on this!

Mick.

Friday, 20 January 2012

STV Group - Breakout from Downtrend?

STV Group (LSE: STVG) closed at 102p today, seemingly confirming the breakout from the downtrend of recent months (see below)...


As can be seen, the OBV has kicked up nicely in the past few days and there is a buy signal on the ADX indicator. Presumably, recent trading has been making progress - making the ITV settlement less of a drag on the results? Will 2012 be the year of recovery for STVG? Let us know what you think...

Sunday, 22 May 2011

Real Good Food (54.5p) - Breakout?

Real Good Food Group (AIM: RGD), one of our sharepicks for 2011, looks as if it is on the move again!


Following a lateral breakout from the minor downtrend of the last month or so, a buy signal seems to be indicated by the price action (see graph) and also confirmed by the Stochastic and ADX indicators.

The AGM is due on 2nd June - do you think there is more good news to come then?

Tuesday, 21 September 2010

GTL Resources - breakout?

At the first glance, todays move in the share price (up 5p or 8.26%) to 65.5p, doesn't seem overly significant. However, have a look at the SP graph again. It seems to show a breakout above the upper (resistance line) of the 'against the trend' wedge. This is considered by technical analysts to be a bullish move.

Using fundamental analysis, particularly the low PSR, also confirms that it's worth holding on to these IMHO. Have a look at the GTL research note on the website.