Mobile Streams, the Company that sells 'apps' (mobile phone applications), closed up 25% (at 11.875p) today. The long-term SP graph shows a downtrend, since the high of 36.75p (18th March 2011) - see the graph below...
Looking at the shorter term graph, this is even clearer (see below)...
You'll note that the ADX has given a buy signal today and that the OBV has kicked up too. So what about the fundamentals?
Looking at the Sharescope key metrics (below) is interesting!
The first thing to note is that the key metrics (along with the newsflow - particularly the
half year results) indicates that the Company is growing quickly. Secondly, the PSR is well below 1 (see the turnover figures above, compared to the MCAP). This gives opportunity for us DIY-Investors in my opinion.
The price action since the start of the year, shows the clear breakout that seems to have taken place...
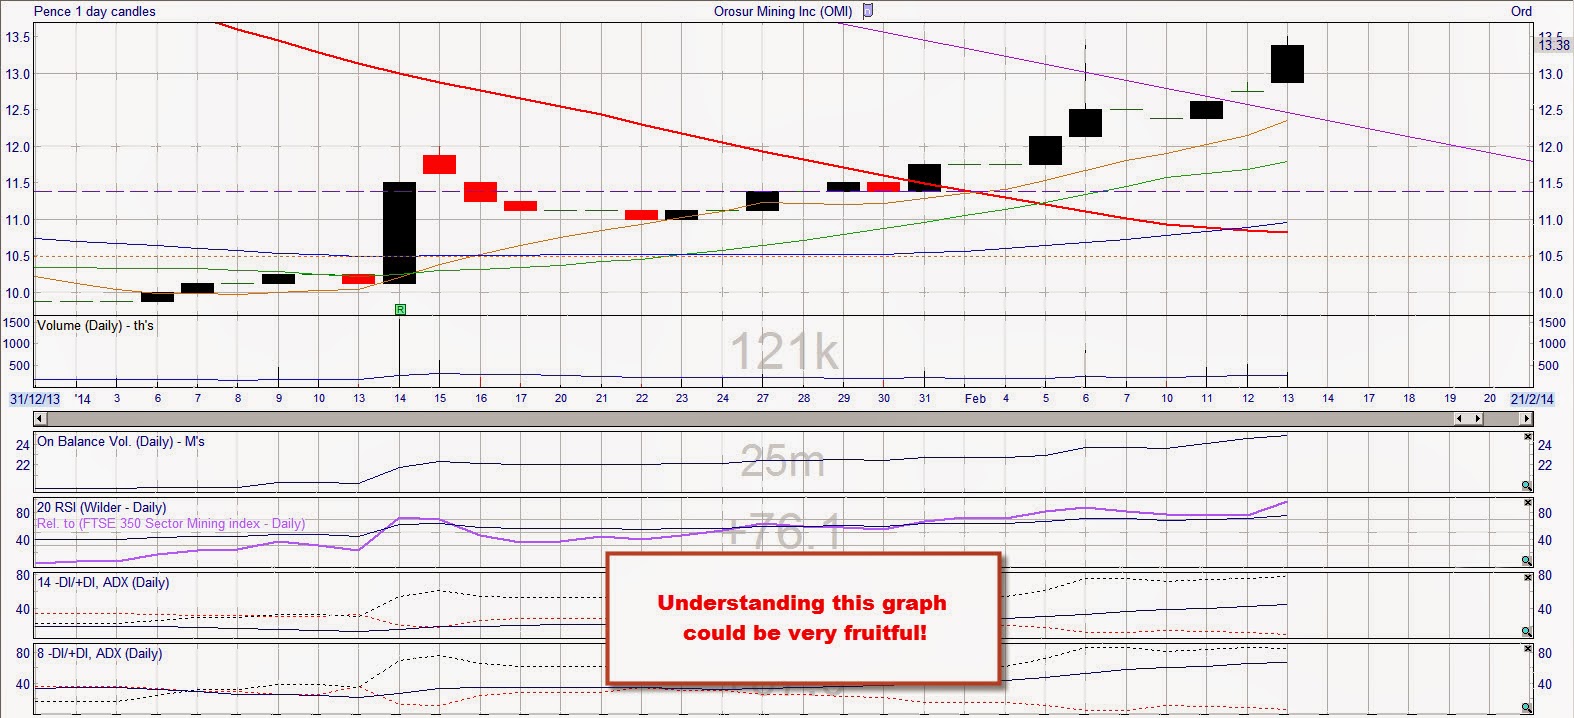
Here you can see the clear kick up in the OBV & RSI, together with the buy signals on both the fast and slow ADX indicators. You can also see that the price has broken significantly up through the 50 day moving average (blue line) on high volume.
As always, DYOR and make up your own mind!